
Contour’s Expression board lets you add custom functionality to your Contour analyses. Using Spark SQL expressions, you can derive new columns, filter data, and perform aggregations in ways that would be cumbersome or just not possible with Contour’s other boards.
In this tutorial we’ll see how to use Contour Expressions through a few examples that you can use in your own analyses.
You can watch a video version of this tutorial on YouTube.
How Contour Expressions are different
Let’s start by adding an Expression board. It’s available under the Suggested, Filter, Transform, and Edit Columns menus. You can also add it by typing <code>CTRL</code> + <code>B</code> on Windows (<code>CMD</code> + <code>B</code> on Mac) and searching for the Expression board.
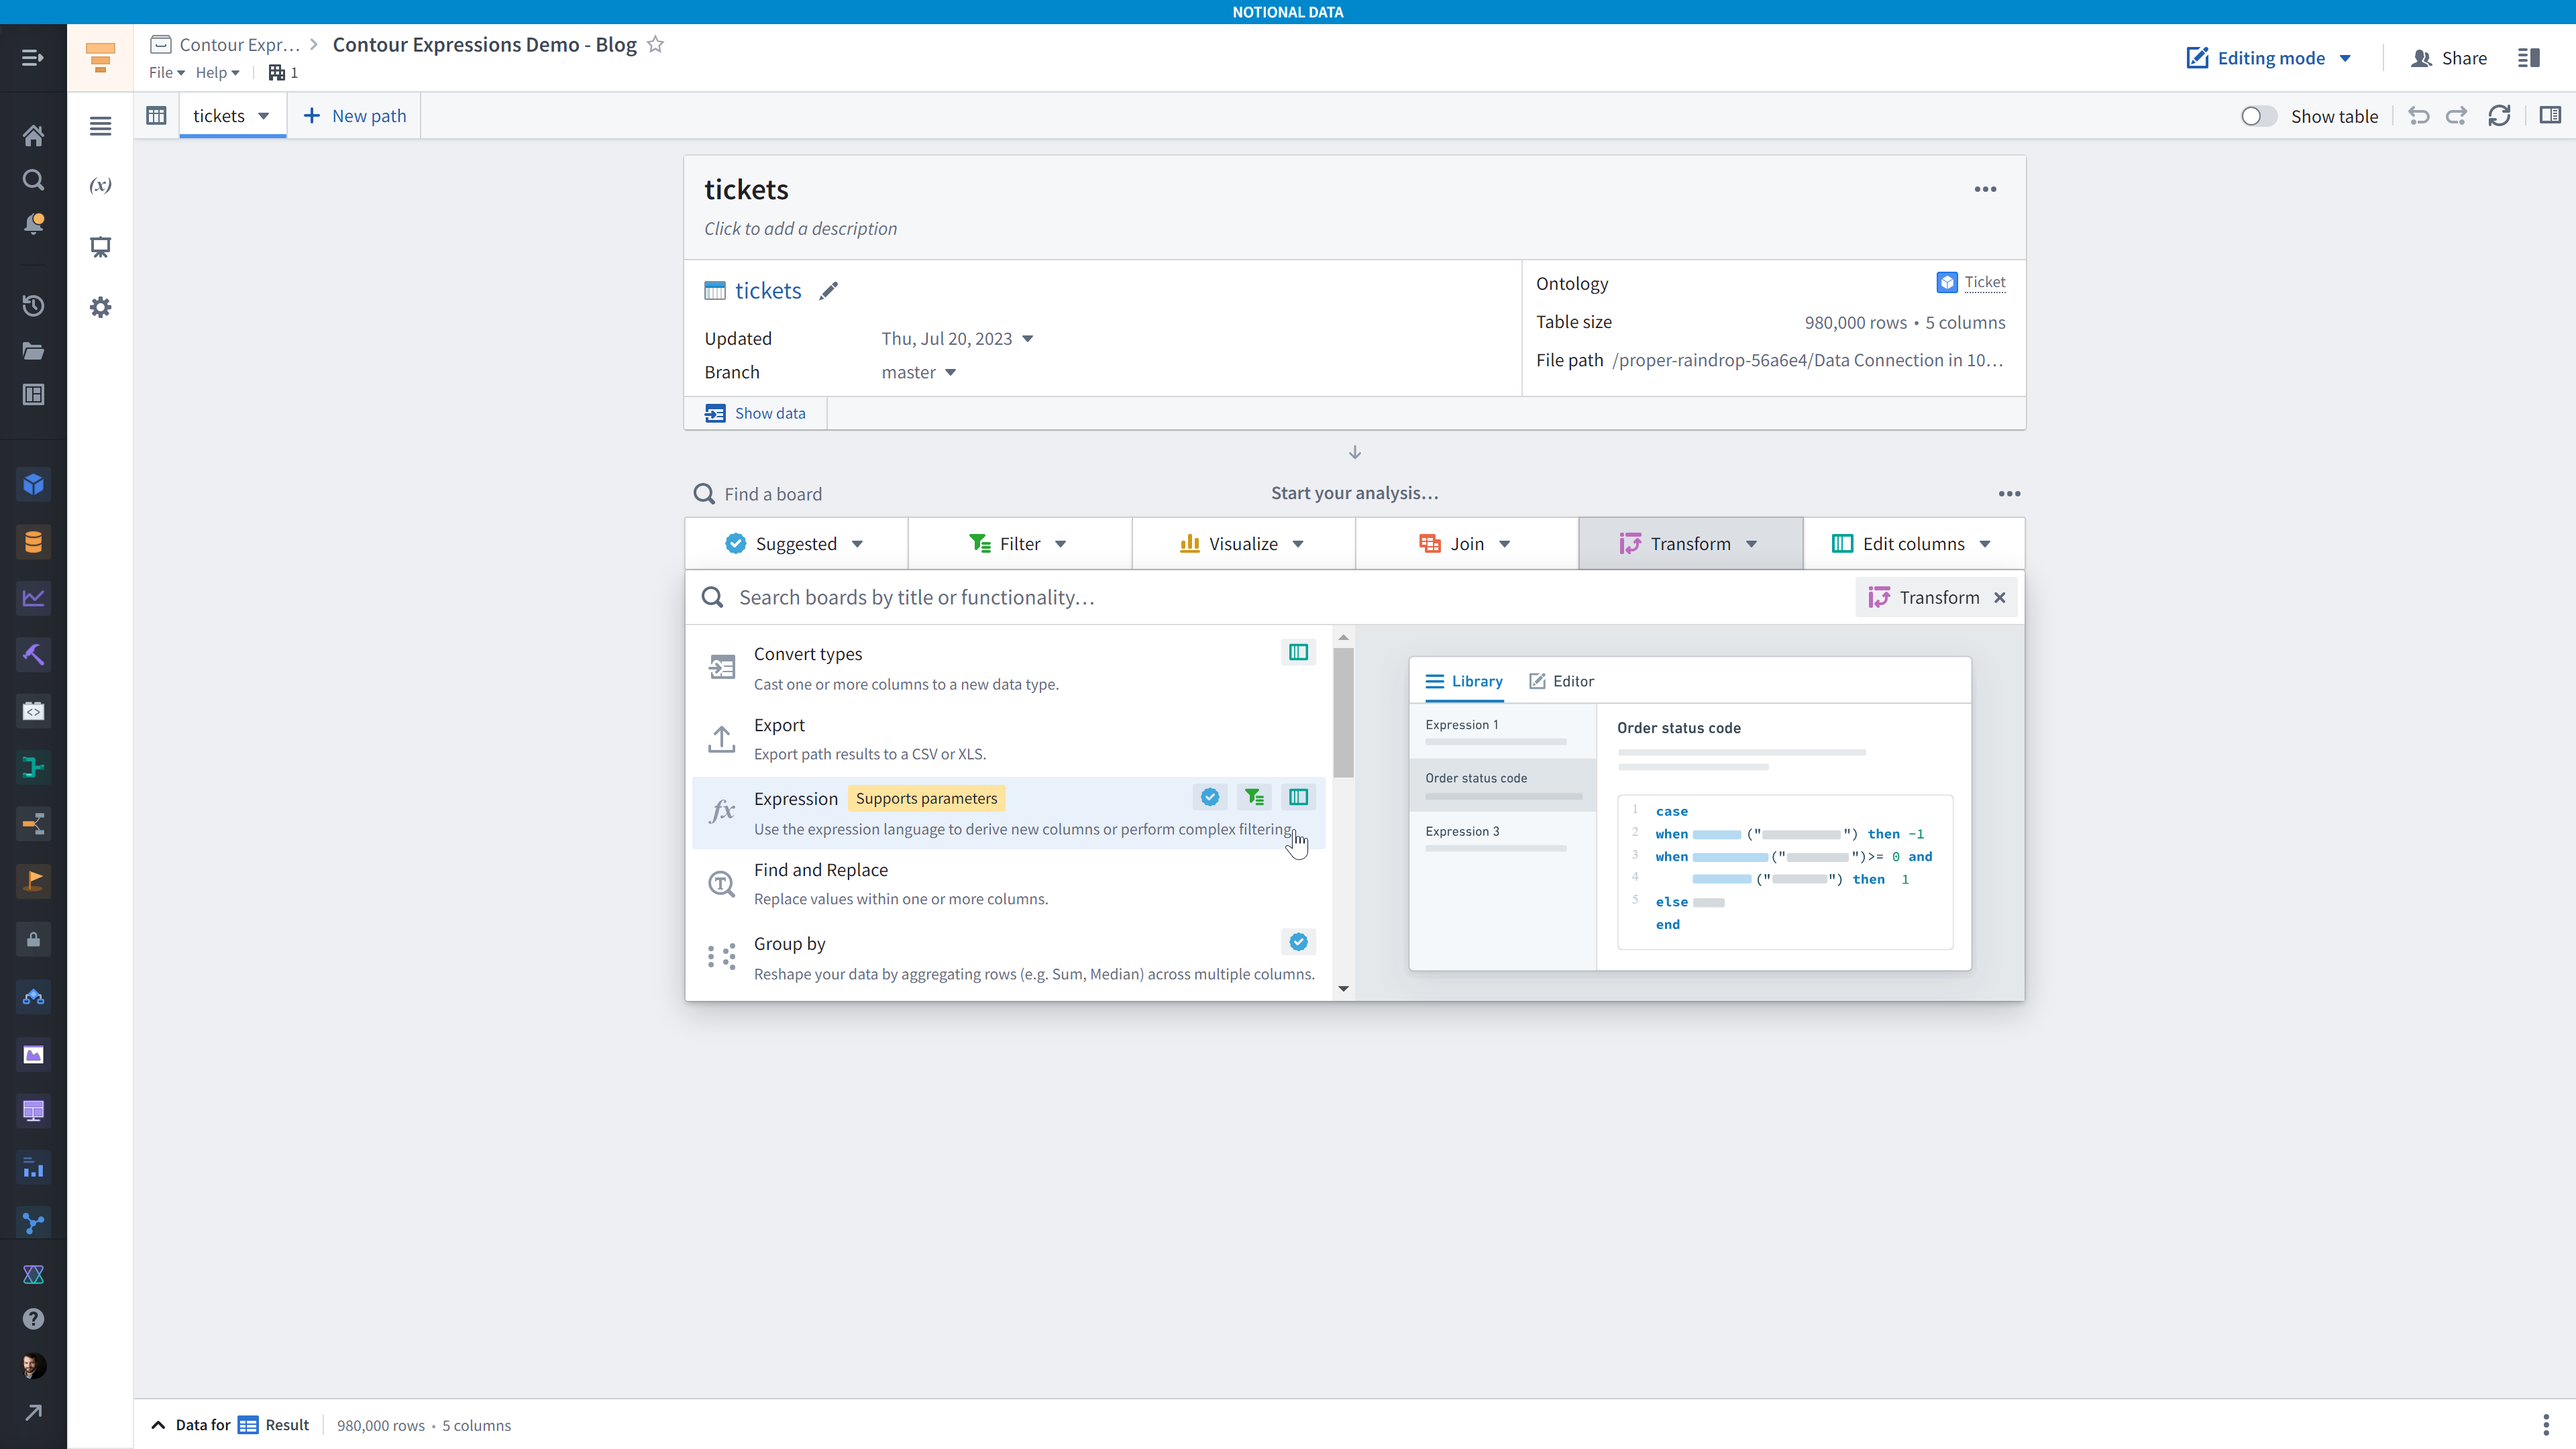
You’ll see the Expression Library pane by default, so click either the Editor tab or the Write new expression.
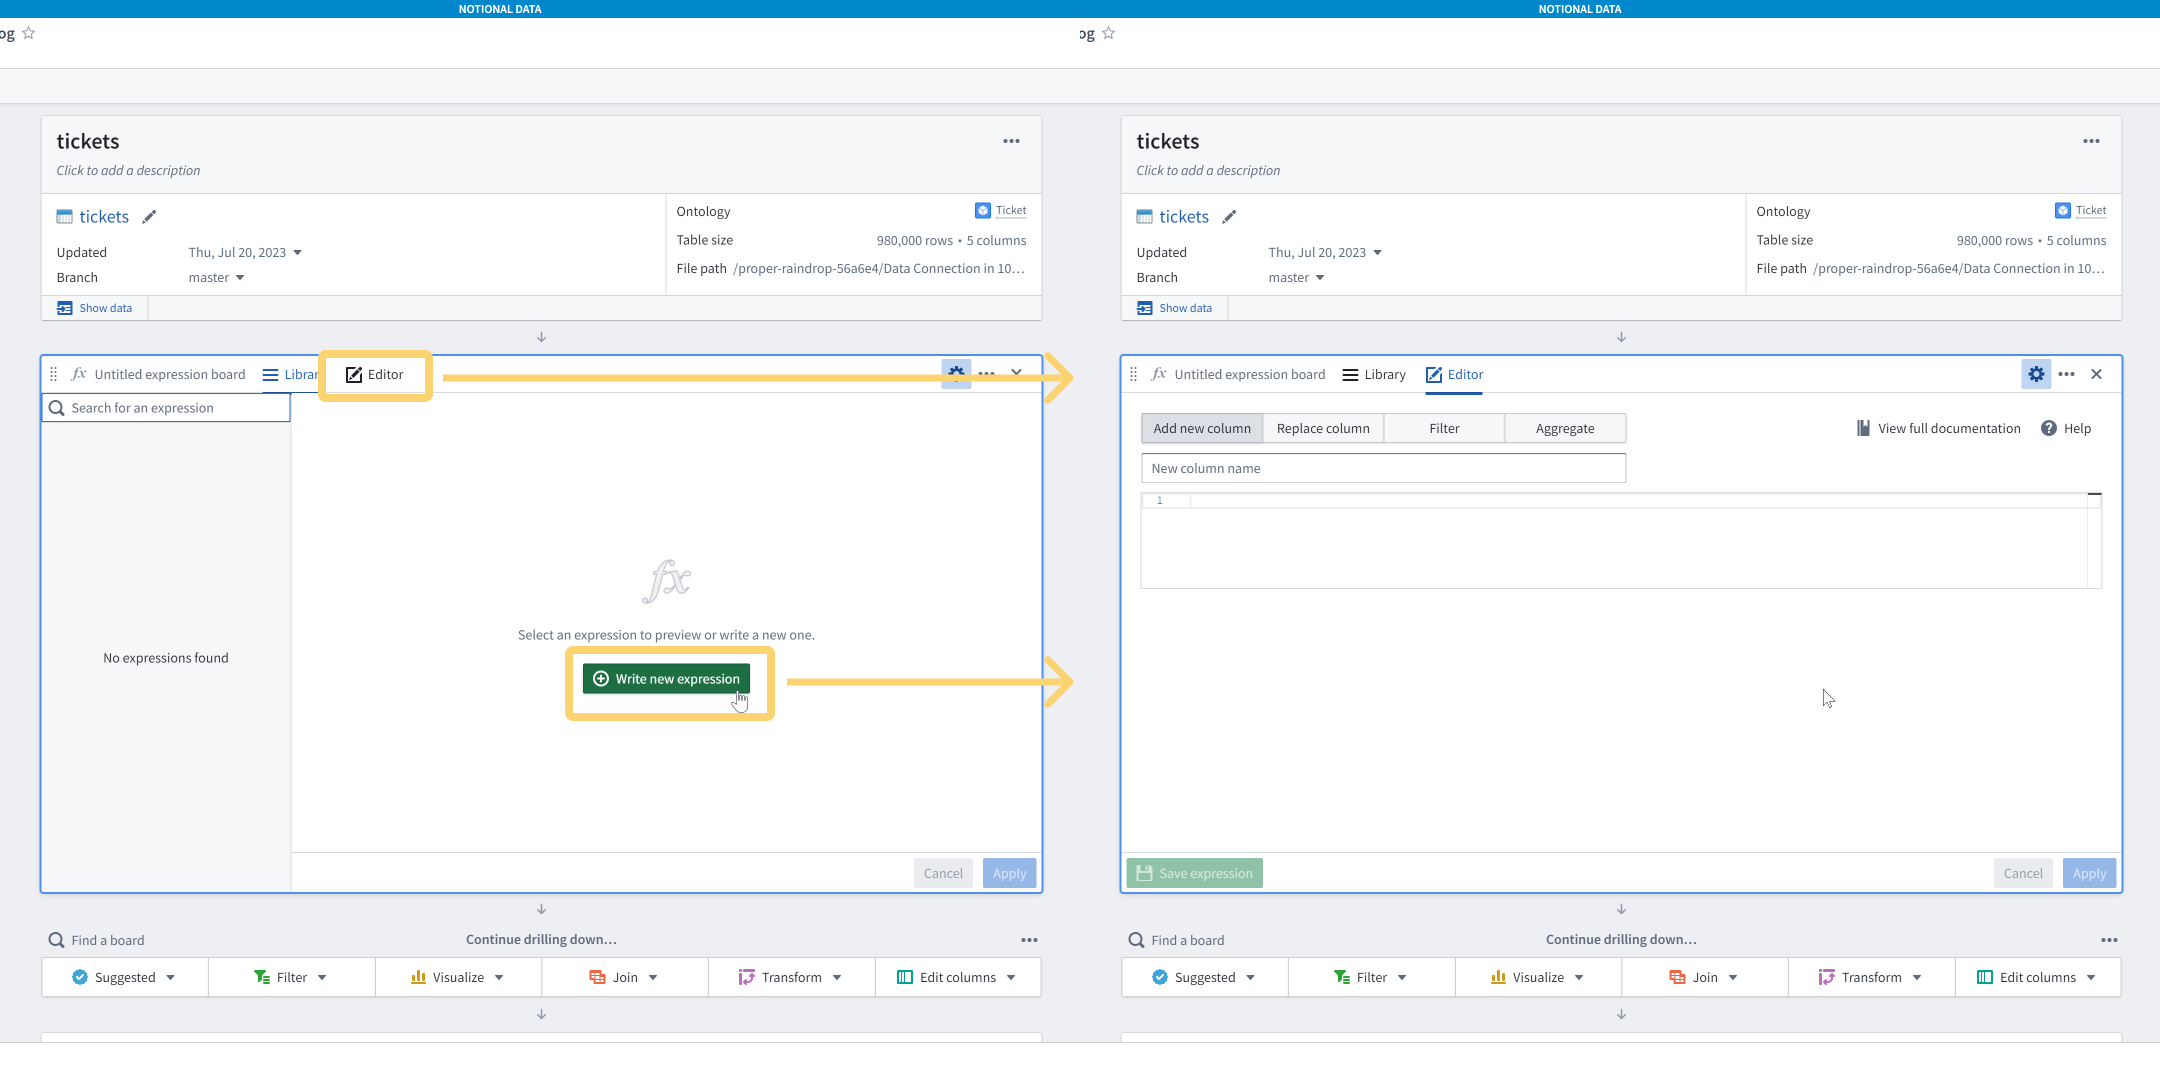
Many people, when they see this text area with SQL auto-completion, start writing a SQL query. This doesn’t work and it’s worth pausing to explain why.
One reason it doesn’t work is that they use the syntax of whatever SQL dialect they’re used to. For example, MSSQL, MySQL, Postgresql, etc. all have slightly different ways of writing the same command, so you need to take those syntax difference into account.
Contour uses Spark SQL, and you can find reference docs both within the Contour Expression board (”Help” in the upper right), in the Palantir Foundry docs, and the Apache Spark docs.
The other reason their SQL doesn’t work is that the Contour Expression board only accepts SQL expressions, not SQL statements.
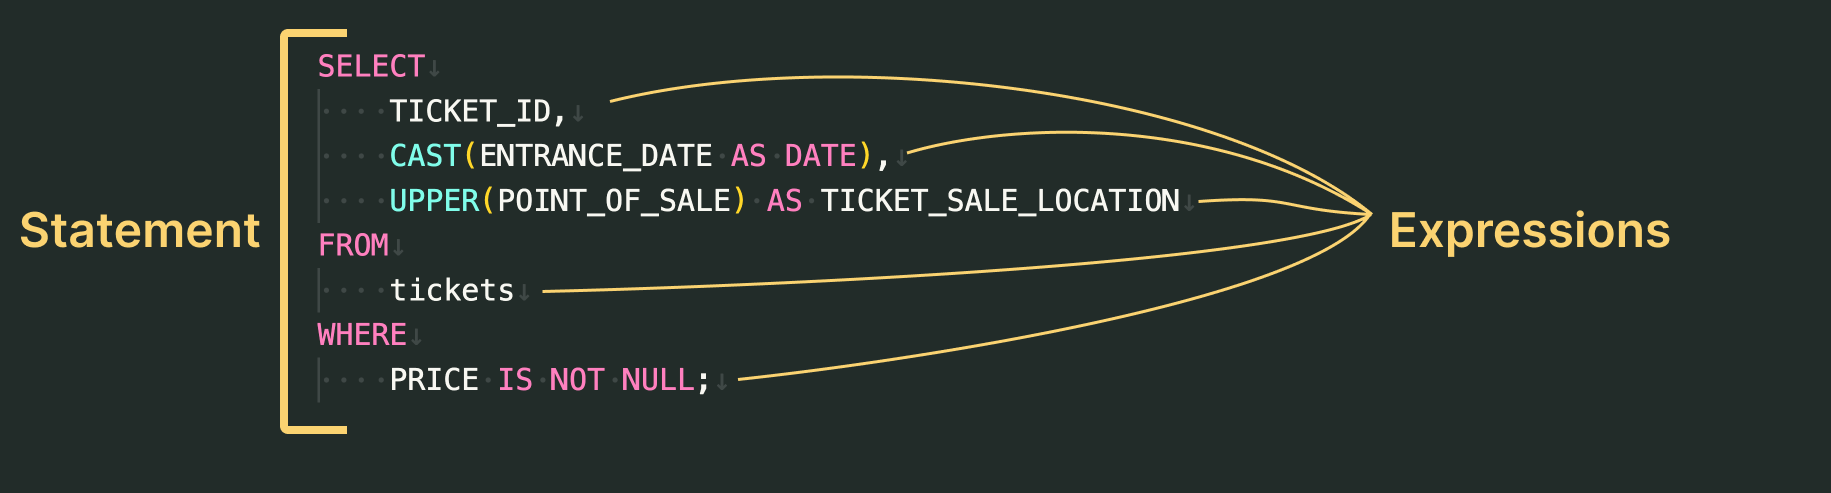
Here’s an example of a SQL statement. SQL expression are parts of the statement. A statement can contain multiple expressions, and each expression can produce a scalar value (e.g. a number, a boolean value, a string) or a table, such as when you have a subquery.
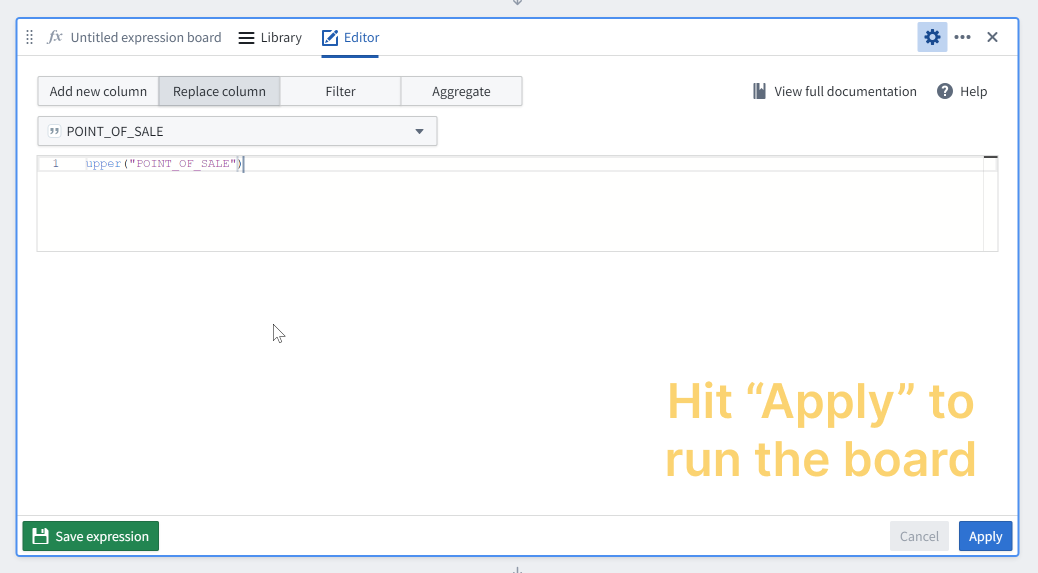
So, if we wanted to add a new column where the <code>POINT_OF_SALE</code> column values are uppercase, we would instead simply write the <code>upper(POINT_OF_SALE)</code> expression in the text area and we would give that a name. Of course, it would probably make more sense to replace the <code>POINT_OF_SALE</code> column instead.
Quick tips
Before we get into more complicated expressions, here are a few tips to make using the Contour Expression board a bit easier.
- Double quotes are for column names, single quotes are for strings in your expressions. If you don’t put quotes around your column names, that will still work too.
- When typing, hit <code>TAB</code> to accept any of the auto-suggestions
- There’s no auto-formatter, so you’re best off using your IDE or text editor of choice for that. I like VS Code with any one of the popular SQL plugins.
- You can add comments with the standard double-dash syntax (e.g. <code>--this</code> is a comment)
- You can use common code editor keyboard shortcuts in the SQL editor, such as <code>ALT</code> + <code>SHIFT</code> + <code>DOWN ARROW</code> to duplicate the line your cursor is on.
Case/When
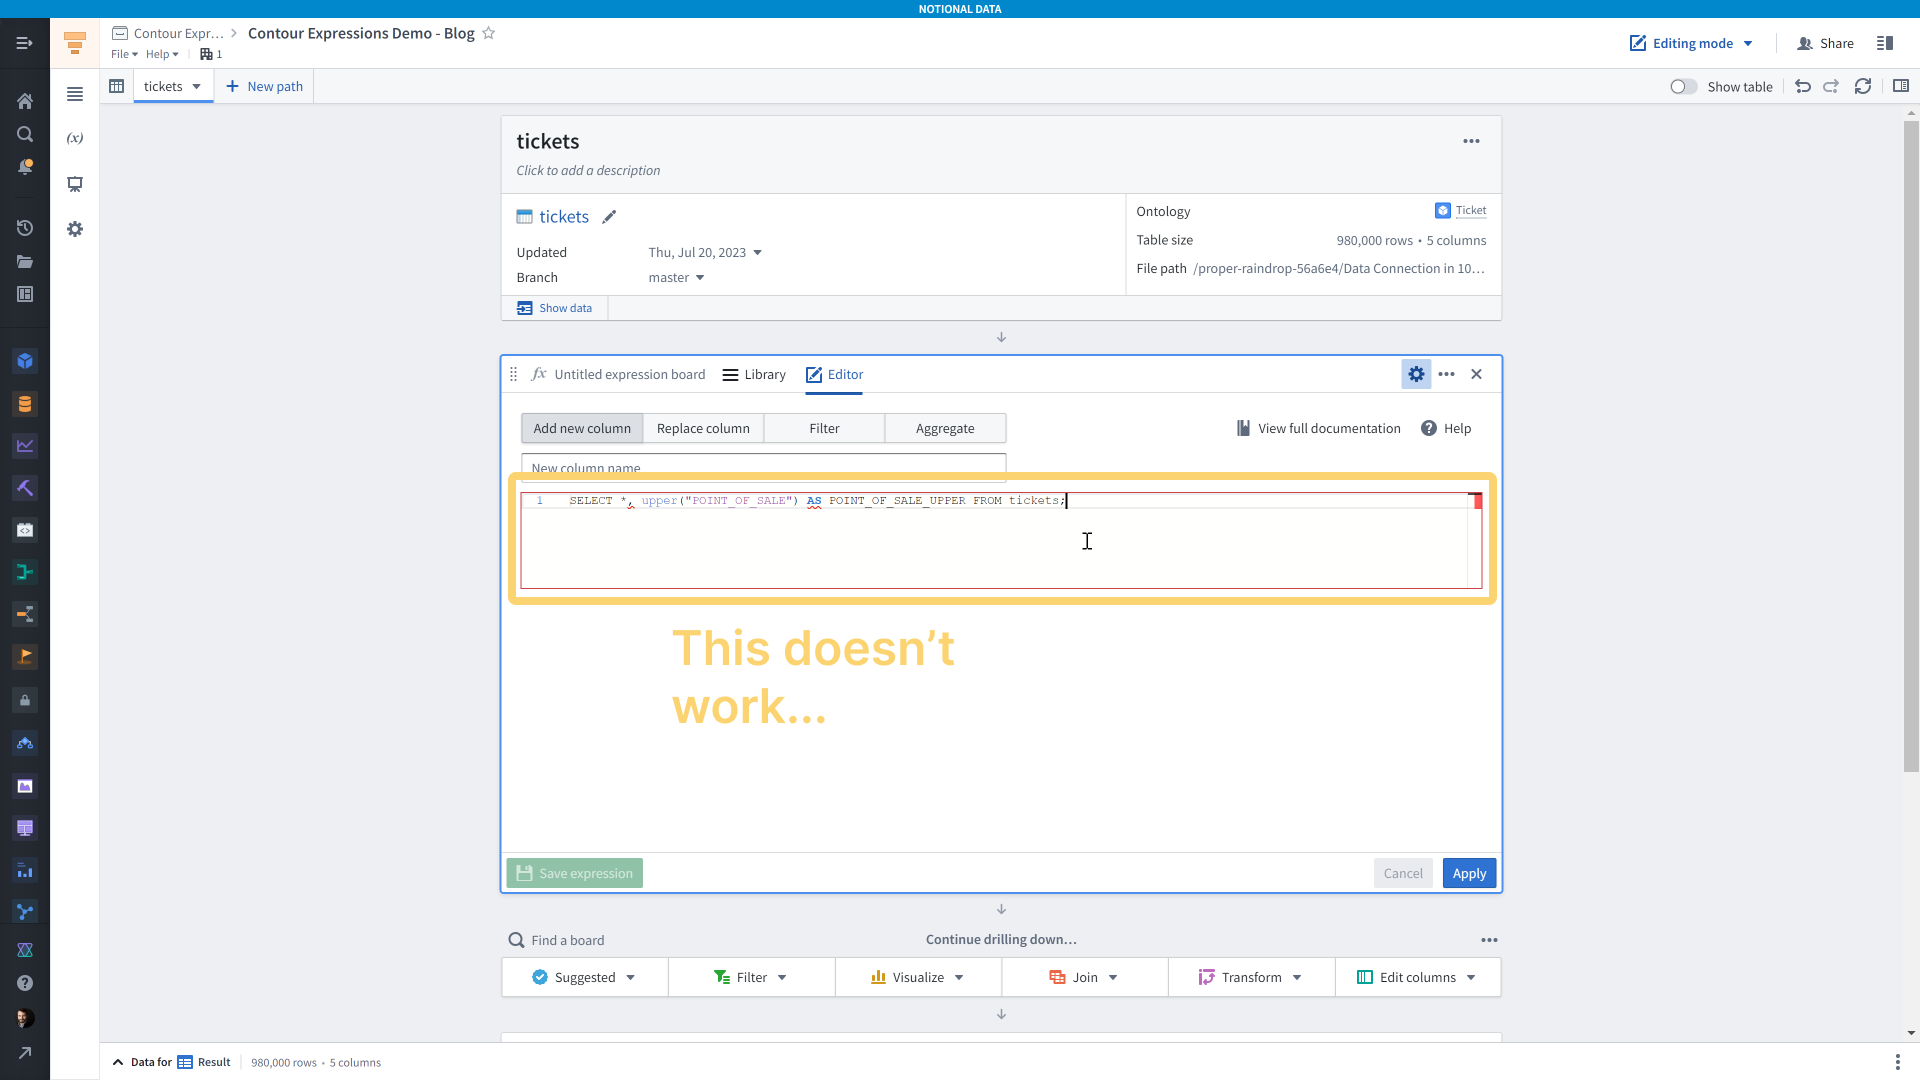
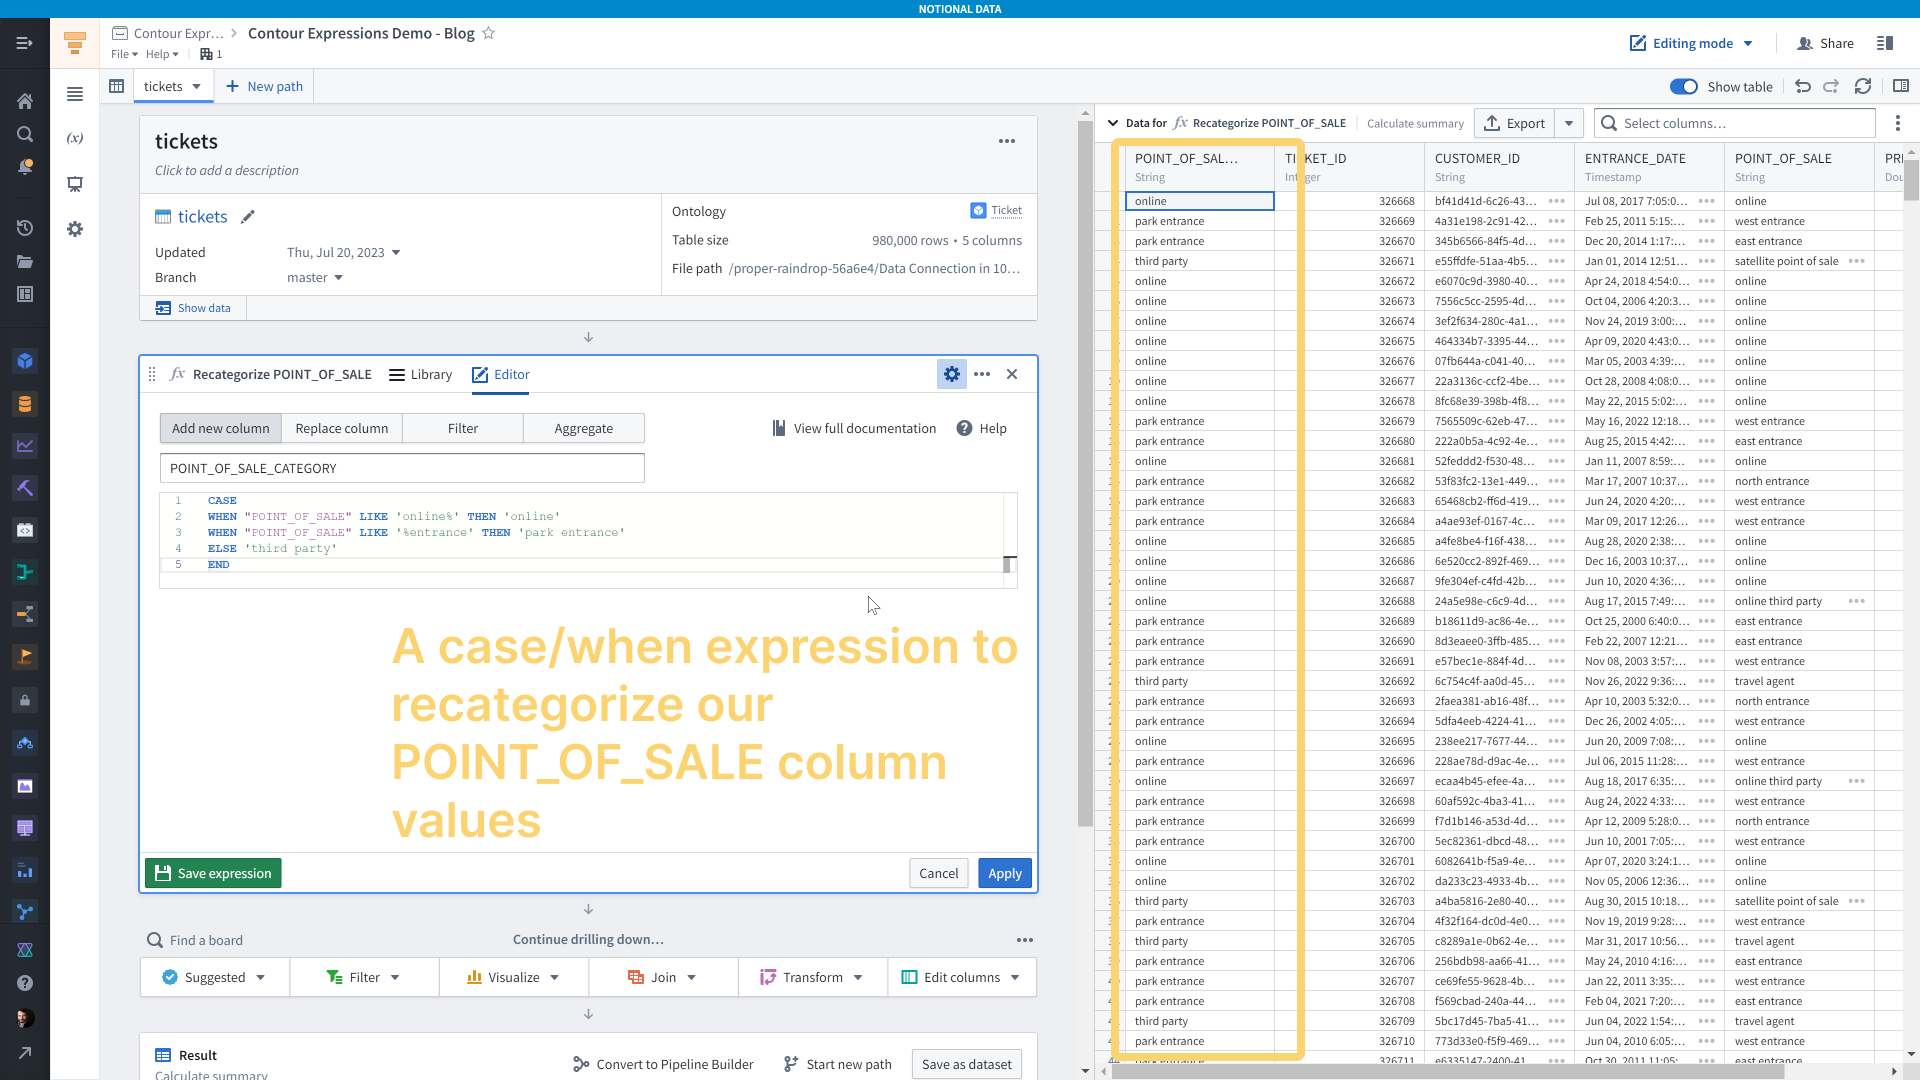
Let’s say we want to reclassify the <code>POINT_OF_SALE</code> values into broader categories. We could do that with a Case/When expression.
Cumulative sum of revenue over time by point of sale
Let’s say we wanted to compute how much revenue was generated by ticket sales by location. For that we would reach for window functions.
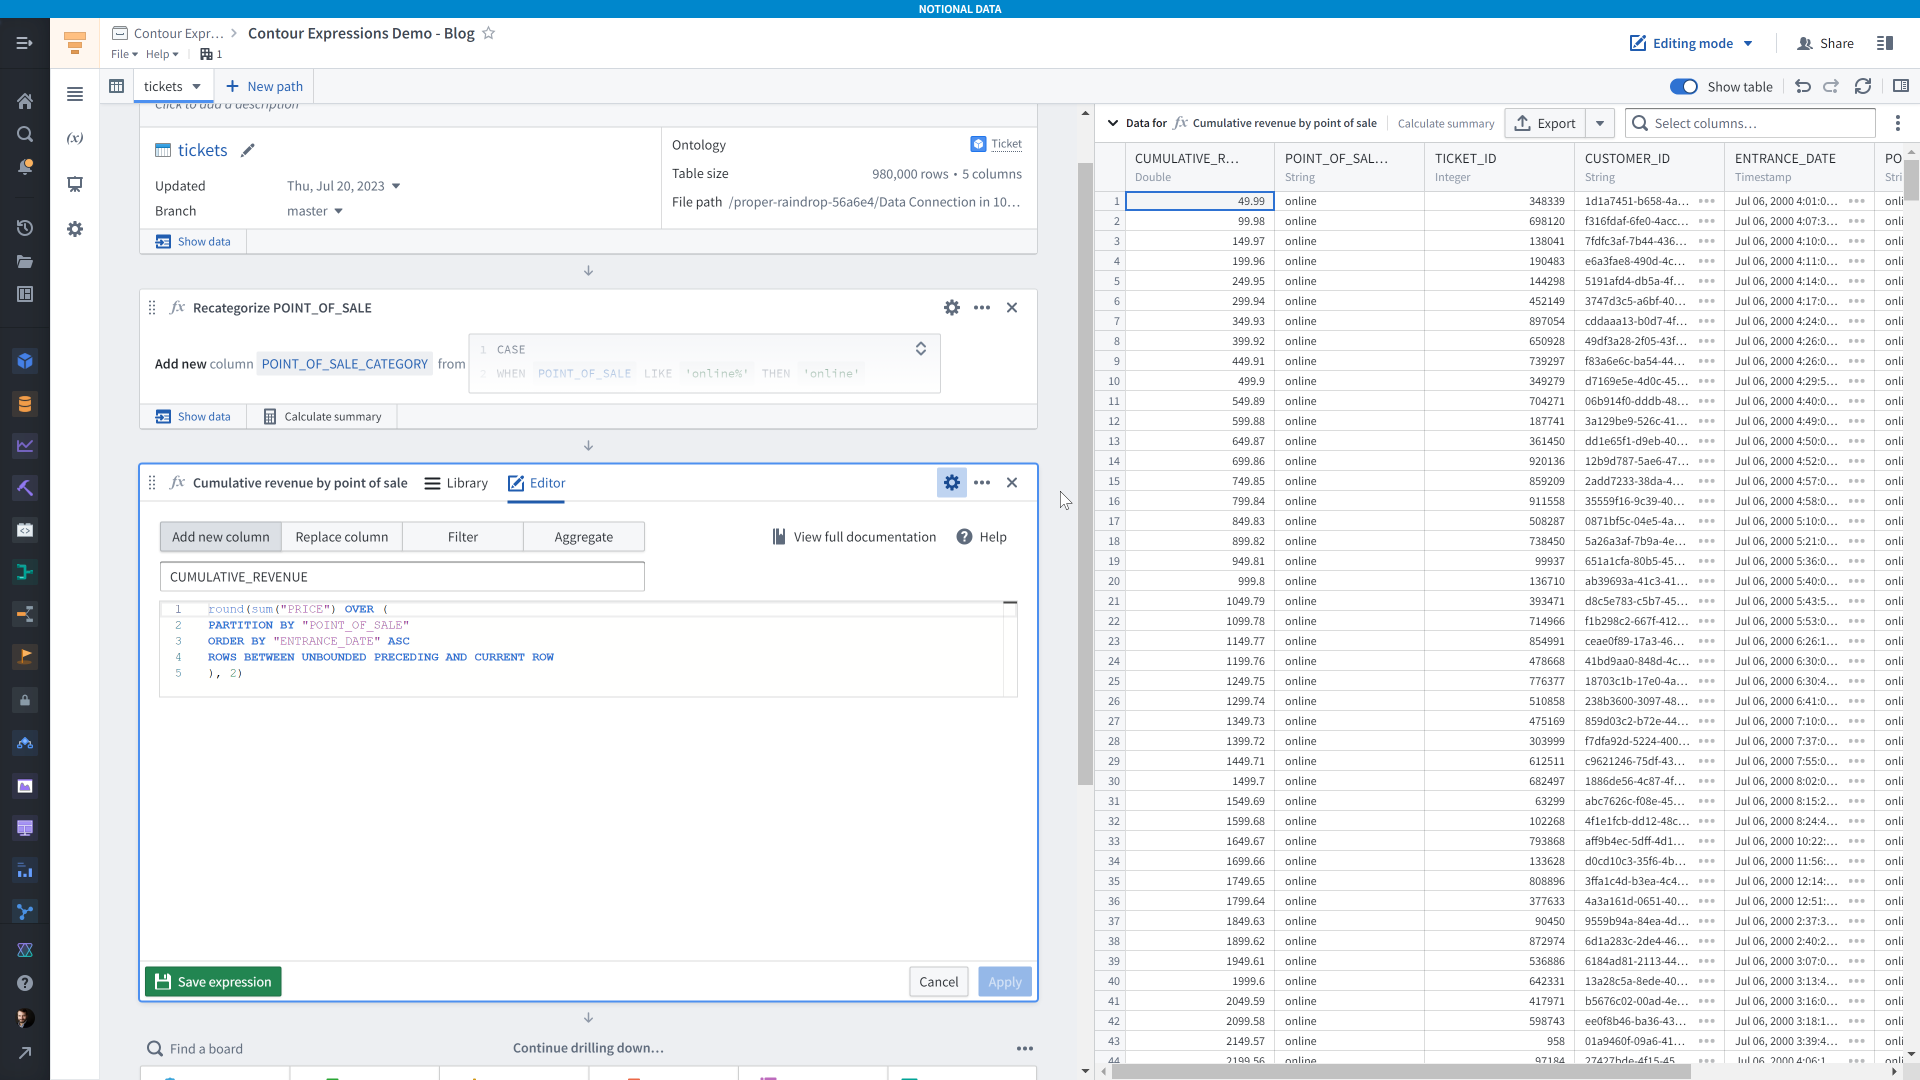
Let’s break down what’s going on in this expression.
The <code>sum(”PRICE”)</code> is pretty straightforward — we’re just adding up values of the <code>PRICE</code> column.
The <code>OVER (...)</code> clause is there it starts getting more interesting. It modifies how the <code>sum(”PRICE”)</code> expression behaves. First we have <code>PARTITION BY “POINT_OF_SALE”</code>, which specifies that we want to compute the sum not for all rows at the same time, but on a group-by-group basis. The way we create the groups is by the values in the <code>POINT_OF_SALE</code> column. This is very similar to <code>GROUP BY</code> in SQL, except we’re not aggregating the table — we’re not changing the shape of the data apart from adding a new column. We keep the same number of rows as we started with.
The <code>ORDER BY “ENTRANCE_DATE” ASC</code> specifies that we want to compute the sum with a particular order of rows in mind. This matters for the last line, <code>ROWS BETWEEN UNBOUNDED PRECEDING AND CURRENT ROW</code>. All that means is “when computing the sum for a given row, include all the rows before it, the row itself, and none of the rows after it”.
Lastly, I’m rounding the whole expression. This was just because my column is a double (don’t use double types for currencies) and I wanted the screenshot to look nice. I could have multiplied by 100 and cast <code>PRICE</code> to an integer before summing (e.g. <code>sum(cast(”PRICE” * 100 as integer))</code>) and then divided by 100 when I was done to get back to cents — that would be more accurate.
However, I wanted to use the round function because it clearly illustrates that the entire window expression is really just one expression. I think you might be tempted to try doing <code>round(sum(”PRICE), 2) OVER (...)</code>, but would result in an error. The round can’t be used to compute aggregates like a cumulative sum.
Filtering to the most recent guest ticket purchase
To give another example of using window functions, let’s get the most recent time a guest entered the park.
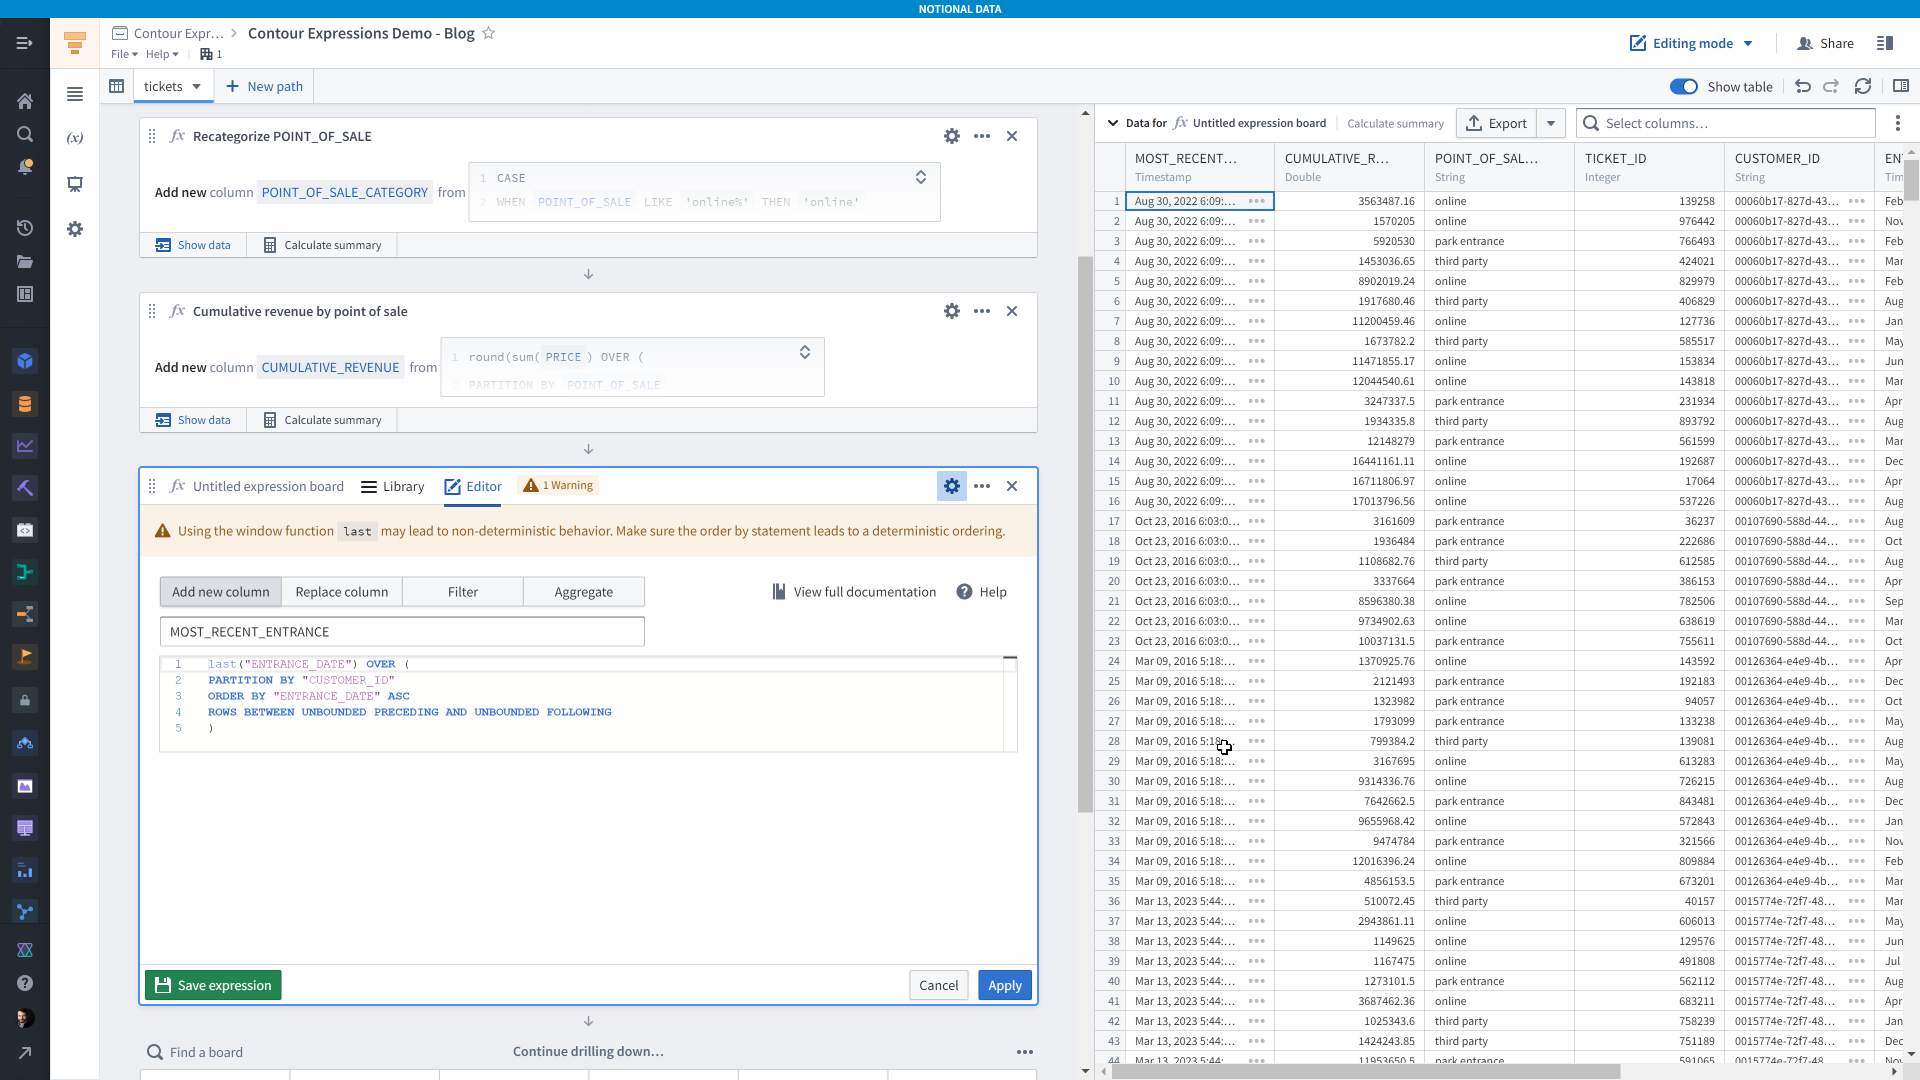
This expression is similar to the previous one, except we’re using the <code>last()</code> function, which gets the last row for a given group (partition). Contour is giving us a warning that “Using the window function last may lead to non-deterministic behavior". All this means is that if you sort the data by a column where there are duplicate values within one partition, then it’s impossible to reliably give you the same order of rows if you re-run this analysis — so make sure that your sorting logic yields only one possible order of rows.
Unfortunately, we can’t use a window function in a filter in the expression board, so to filter the dataset to just each guest’s most recent entrance we’ll need to add another board.
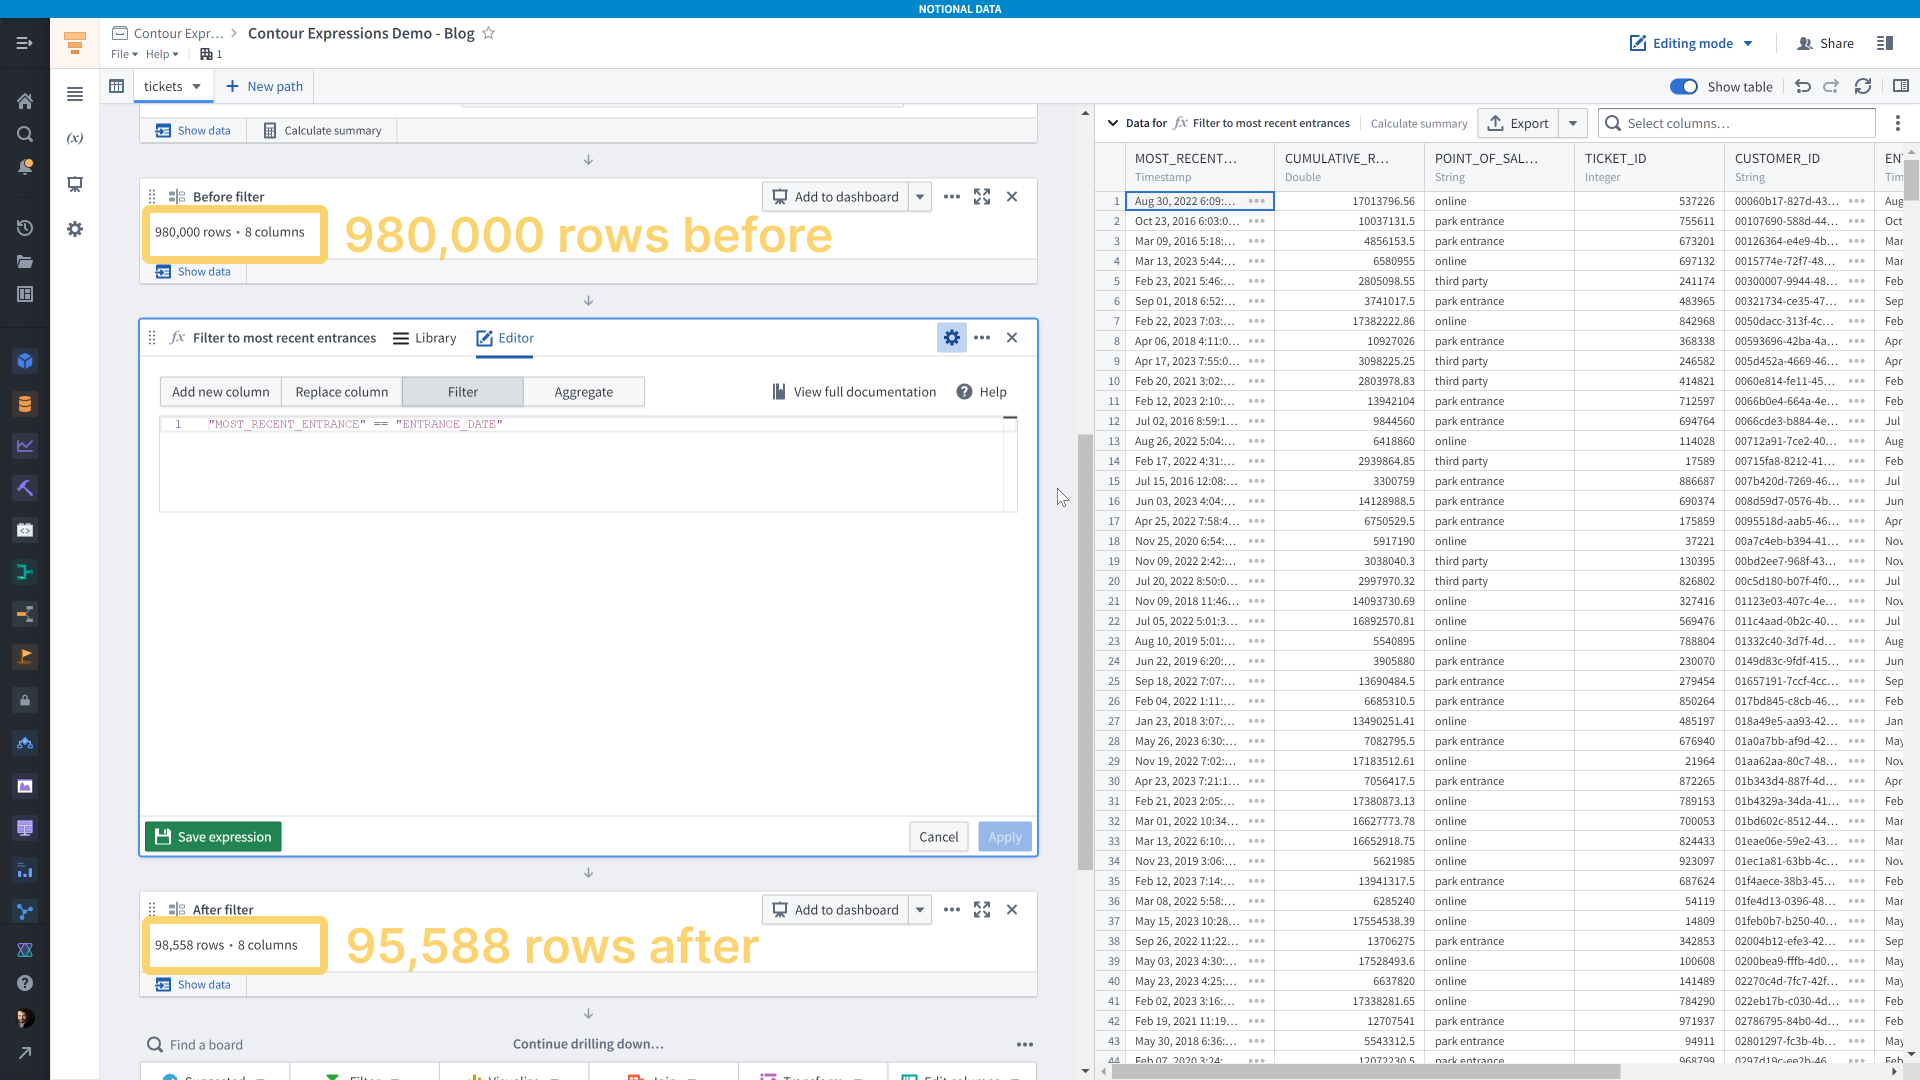
For filter expressions, your expression needs to evaluate to a boolean value — true or false. Here, I’m specifying that the <code>MOST_RECENT_ENTRANCE</code> column that I just created must equal the <code>ENTRANCE_DATE</code> column.
Aggregations
We’ve covered creating new columns, replacing columns, and filtering — the last option for the expression board is aggregations. If I wanted to get the average time of day that people entered the park, grouped by where they bought their ticket, I would use an aggregation.
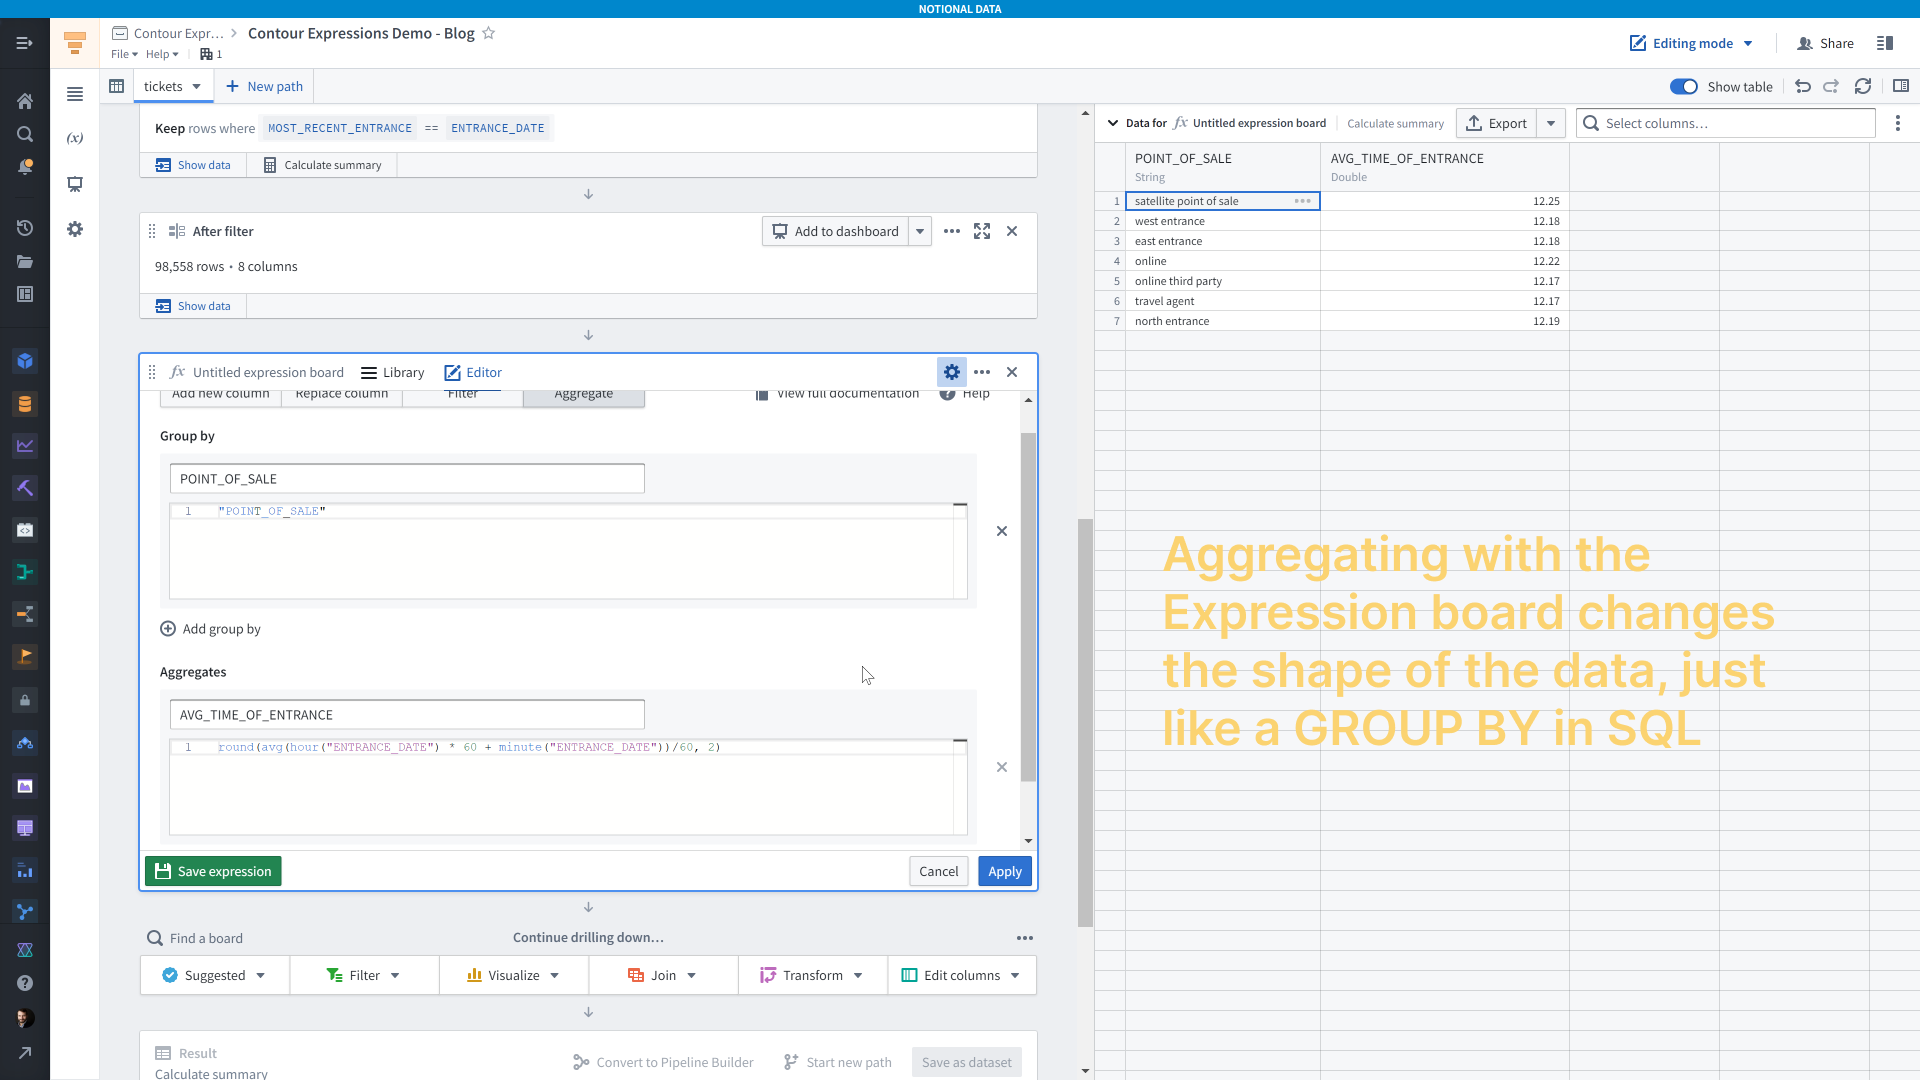
Aggregations act just like a <code>GROUP BY</code> in SQL. Up top you have the “Group by” field where you add the columns whose values you want to calculate an aggregate for. In this case it’s the <code>POINT_OF_SALE</code> column. You can add as many grouping columns as you need and there will be one row for each unique combination of values across these columns.
Below that is the “Aggregates” field, where you specify your aggregation expression. Here I’m using <code>round(avg(hour("ENTRANCE_DATE") + minute("ENTRANCE_DATE")/60), 2)</code> to get the average entrance time in hours for each group. You can also add as many aggregations as you’d like.
A comparable SQL statement would be:
Advanced Expressions
At this point we can start venturing into the land of “just because you can, doesn’t mean you should”. Let’s create an expression for calculating an independent two-sample t-statistic in Contour. There are better options for calculating statistics than Contour, such as Code Workbooks, Code Workspaces, or Code Repositories. But, if you’re already in Contour or aren’t familiar with R or Python, then this could be a good option for you.
This will be a two-step process and we’ll start by calculating the aggregates we need. Let’s imagine that we want to see if the people who bought their tickets online had a significantly different entrance time from people who bought their tickets at the park.
The formula for a t-statistic is this:
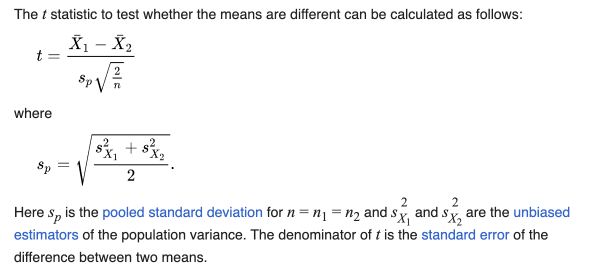
We need the means, variances, and counts of each group — one group being people who bought their tickets online and the other group being people who bought tickets in person. To do that, we have two options. One, we could use a pivot table board, and if you’re doing this just once that will be the faster option. You set your aggregates as mean, variance, and row count and you set the columns as the value you want to group by — <code>POINT_OF_SALE</code> in this case.
Since this tutorial about the expression board, we’ll use that. We need to add six aggregates: mean, variance, and count for each group. We use a case/when expression to make sure we include just the relevant rows for each calculation.
The result is a 1-row table with the values we need to calculate the t-statistic.
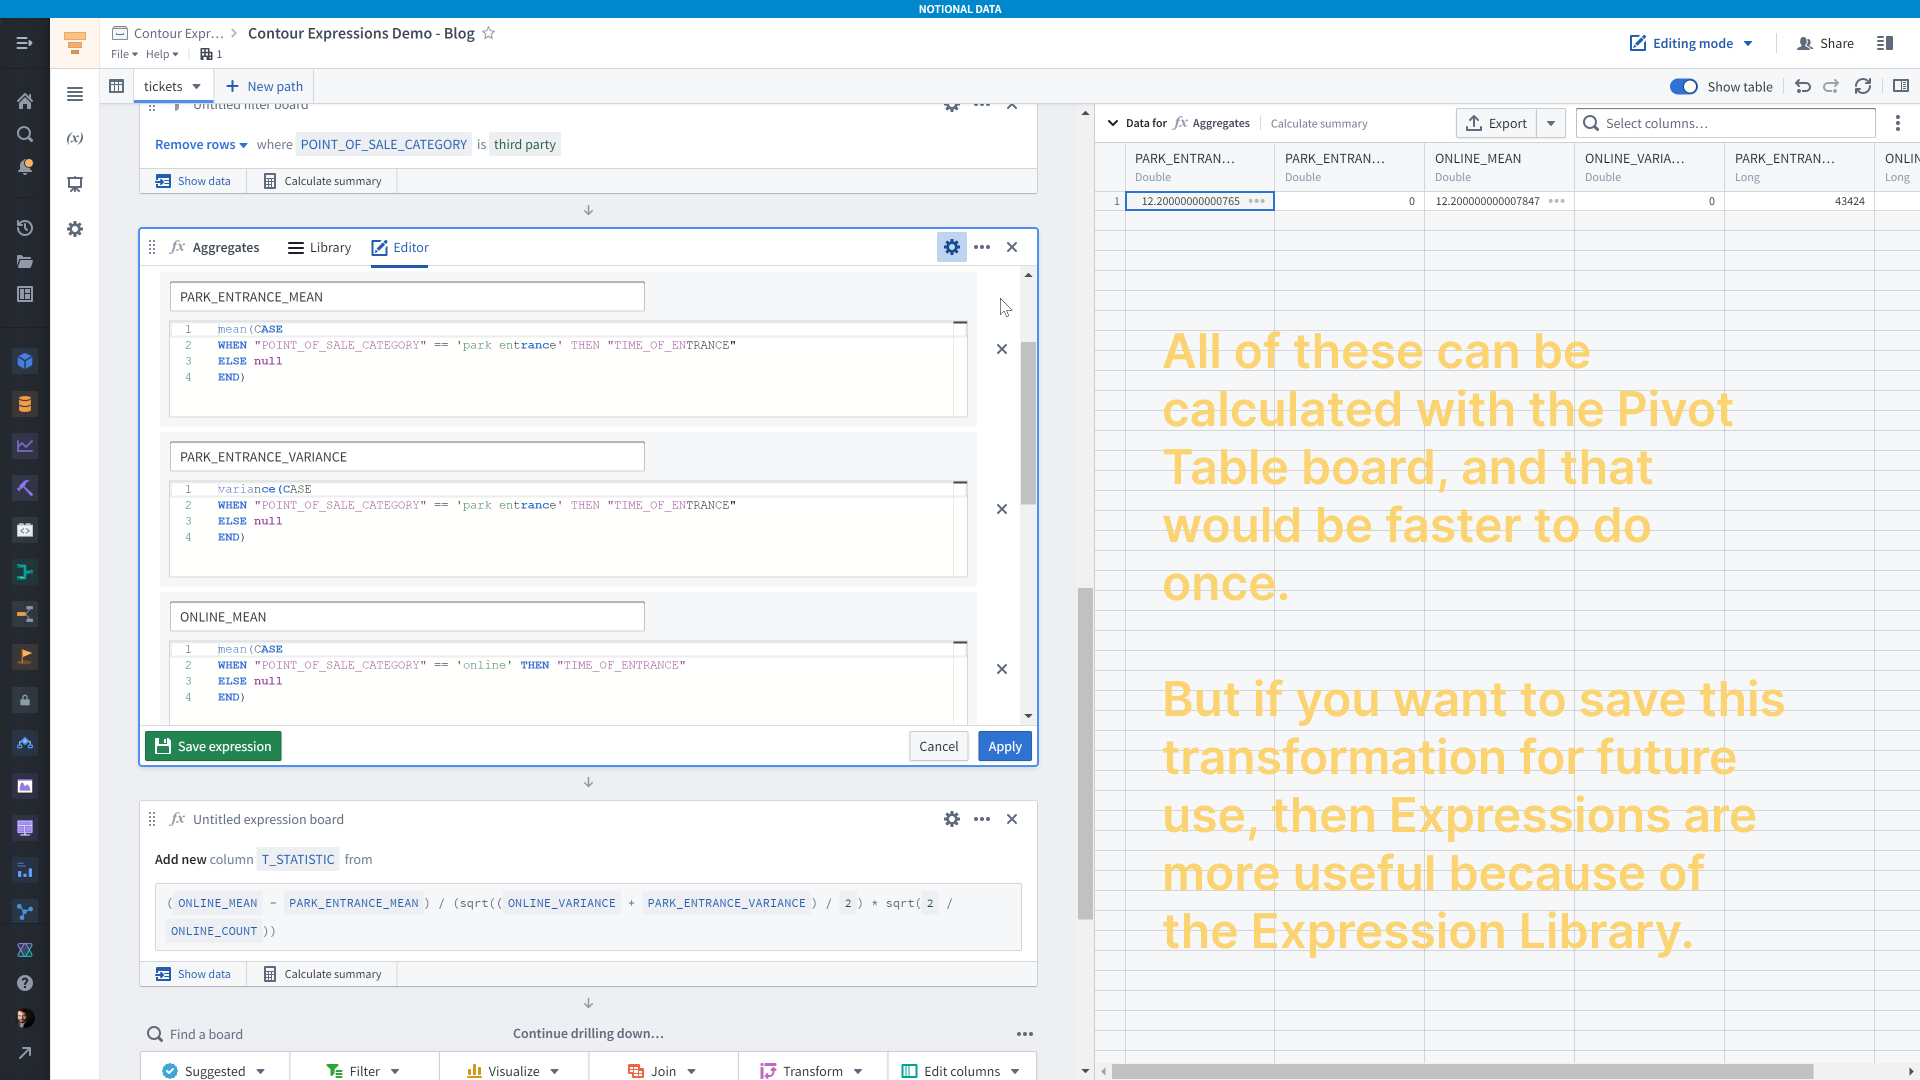
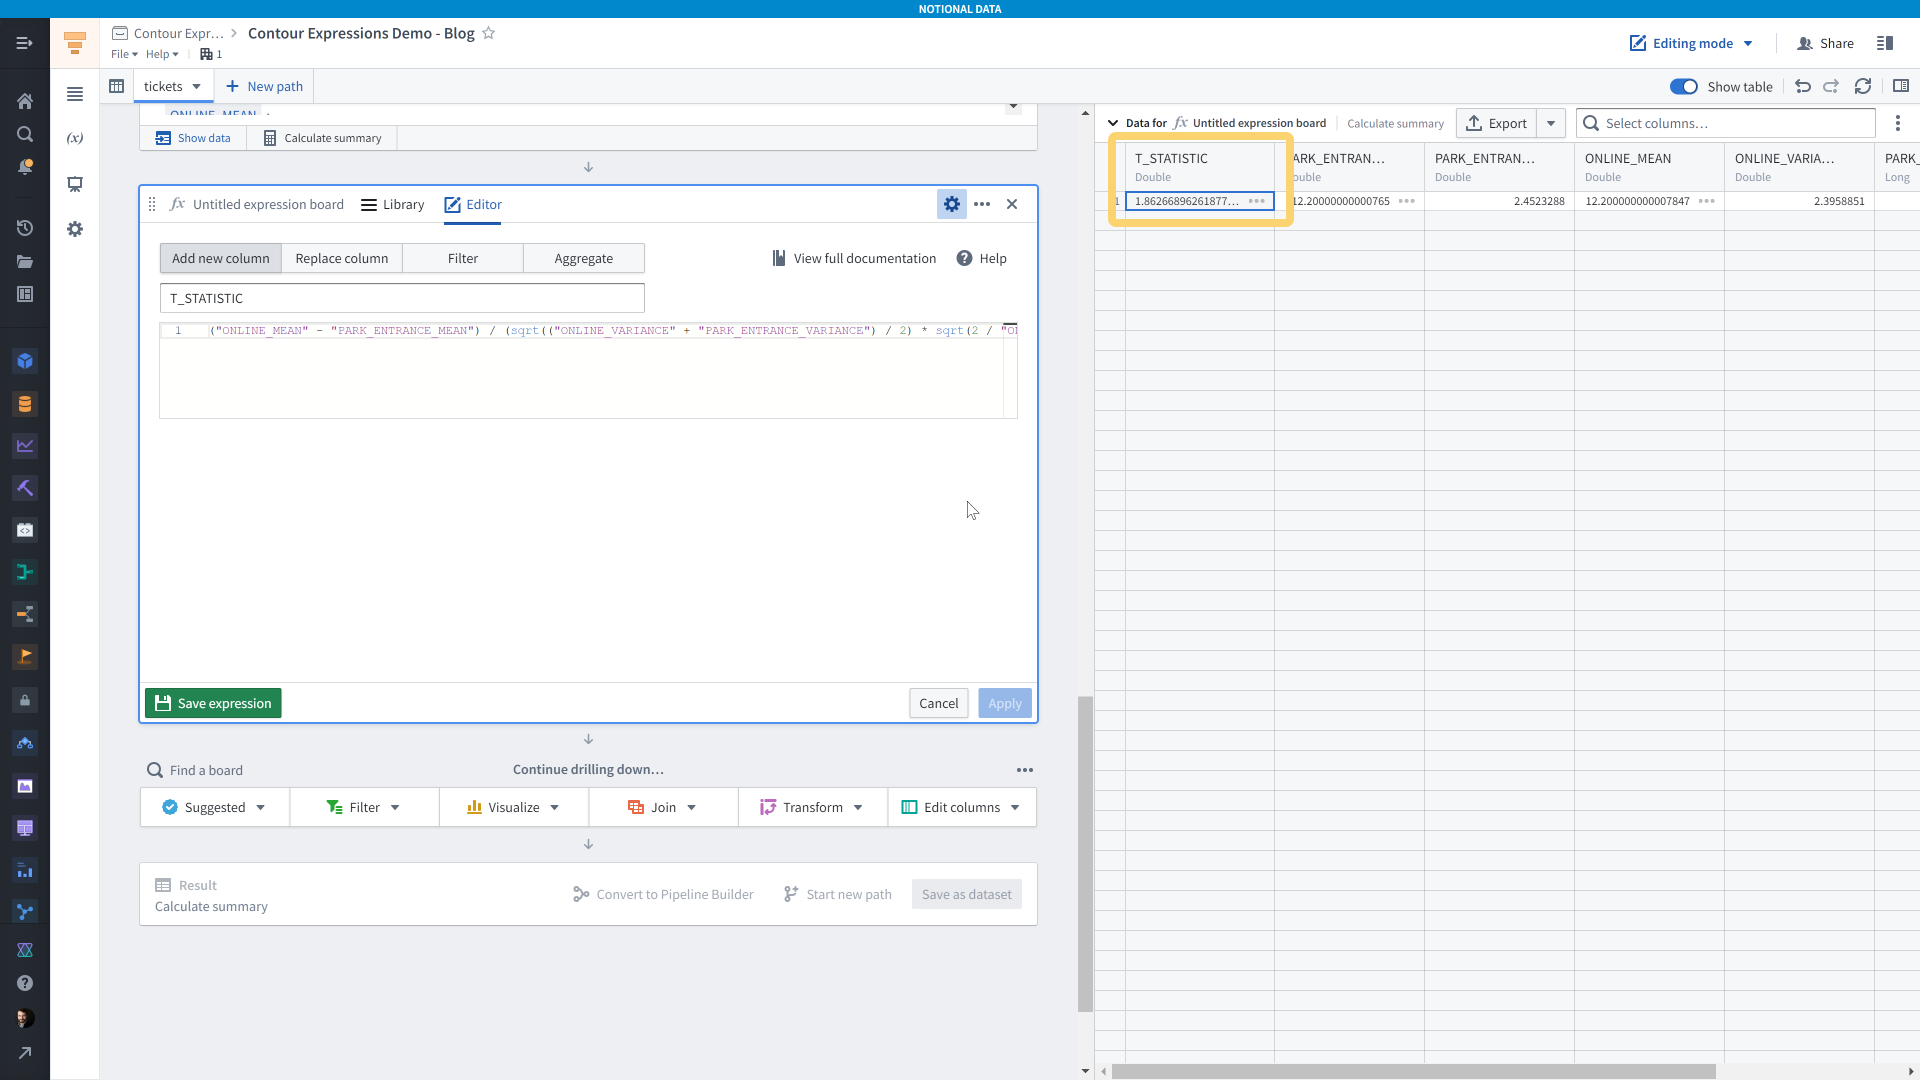
Then, we add a second expression board with a slightly more involved expression that calculates the t-statistic according to the formula shown above.
Parameters in Expressions
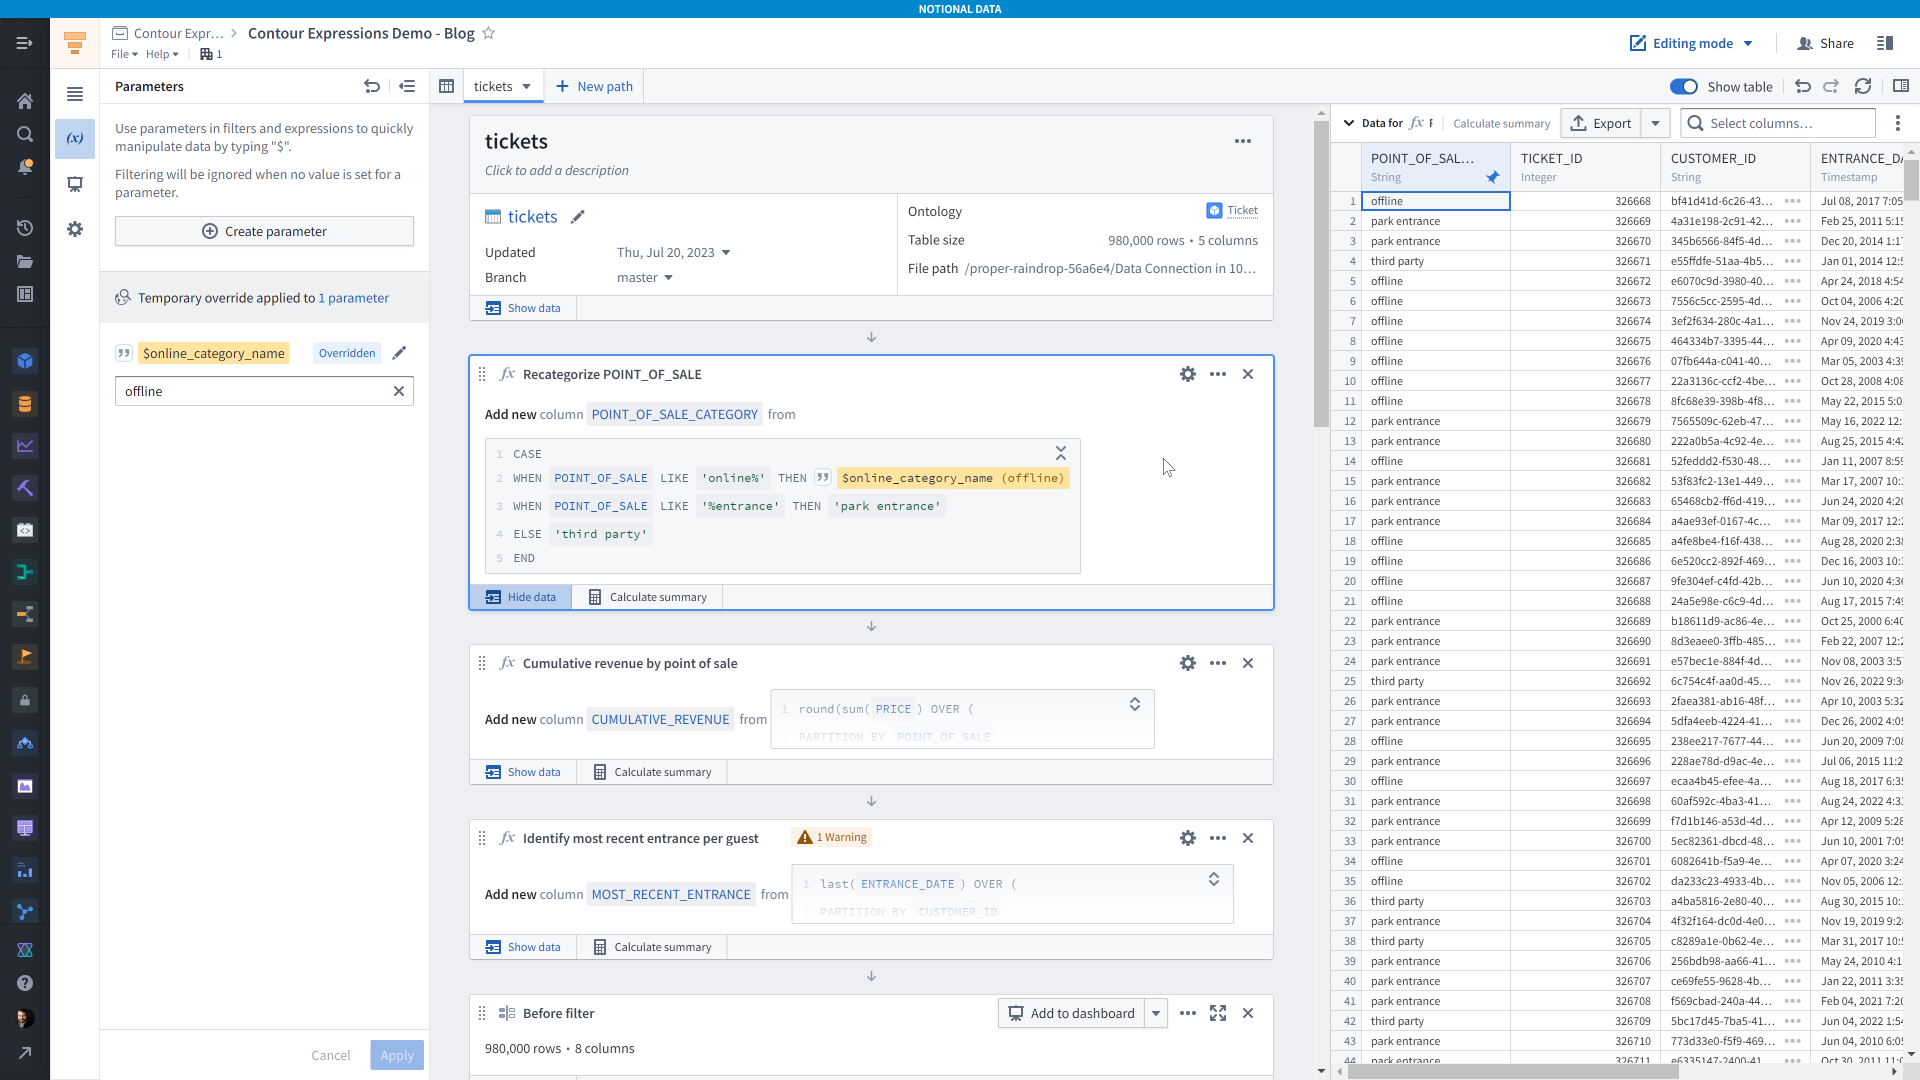
You can also use Contour Parameters in expressions. For example, here I’ve created a parameter to hold the name of the “online” point of sale category name. I’ve used it in the case/when expression from earlier in the path and in the screenshot below I’ve overridden the default value of “online” to be “offline” instead.
You use parameters by pre-pending a <code>$</code>, for example <code>$online_category_name</code>.
Saving Expressions for Future Use
You can save expressions for future use by yourself and colleagues. Saved expressions are available in the Expressions library
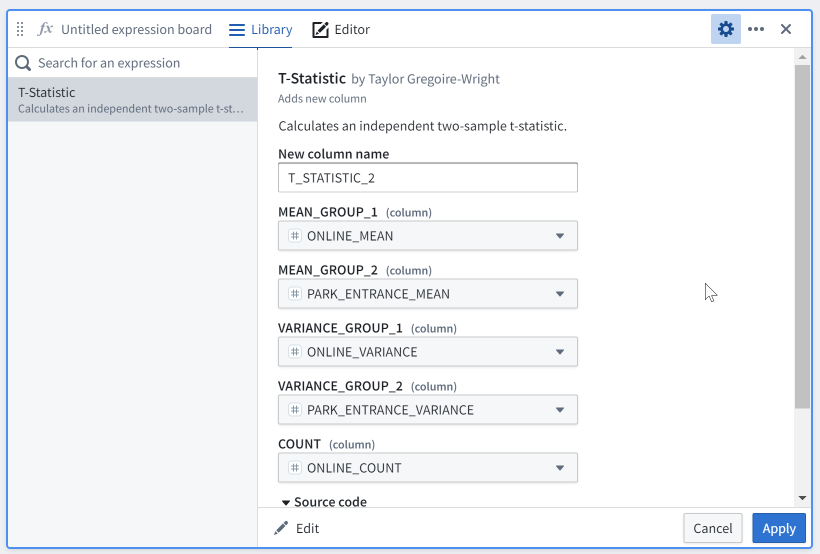
When you save an expression you need to specify what inputs it requires. For example, in the t-statistic expression I wrote I used different columns as input — <code>ONLINE_VARIANCE</code>, <code>PARK_ENTRANCE_MEAN</code>, etc. I want this to be more generally useful, so I rename them to something like <code>MEAN_GROUP_1</code>, <code>MEAN_GROUP_2</code>, <code>VARIANCE_GROUP_1</code>, and so on.
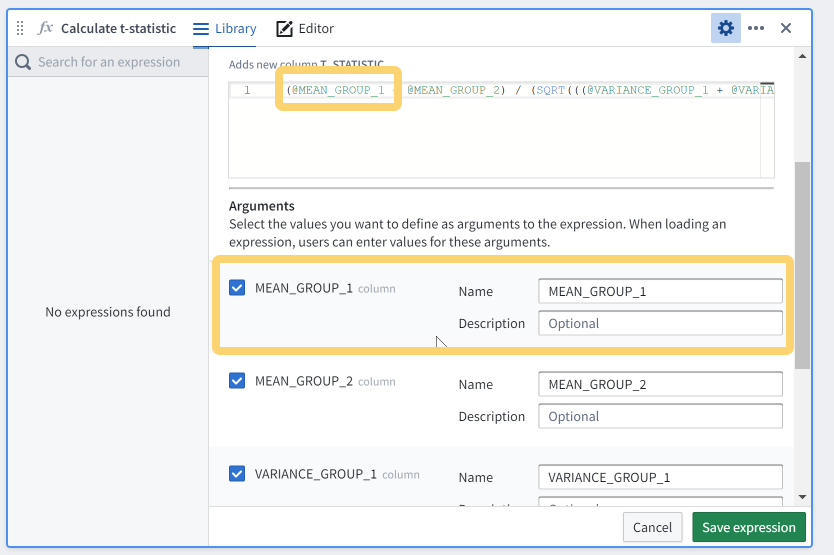
You can give your saved expression a custom name, add a description, and add descriptions for each argument that future users will need to provide when using it.
When you or someone else goes to use a saved expression, it will require you to assign values to the arguments, it will display the expression description, and it will show the source code of the SQL expression you wrote. Over time, you and colleagues can build up a library of useful expressions.
Other saved expressions ideas
Here are some ideas for other saves expressions you might find useful.
Modified day_of_week expression
A modified <code>day_of_week</code> expression that sets Monday as the first day of the week instead of Sunday for countries or regions where that’s the norm.
A rolling aggregate
A rolling average using window functions and RANGE instead of ROWS for the window. This example assumes you’re ordering by a timestamp or date and has a 7 day-long window. Since the <code>RANGE</code> value needs to be an integer, I convert the timestamp/date column to seconds using to_unix_timestamp.
Normalizing values
You could normalize the values of a column so they span between 0 and 100.
Western Electric Rules
You could encode some of the Western Electric Rules, such as the second one listed here.
If you wanted to be a bit more accurate, you could modify that expression to take into account the fact that mean and stddev should be calculated with only the rows up until that point in time (or whatever other dimension you’re ordering by). That would look like this:
Dealing with the lack of subqueries
For me, the biggest drawback to Contour expressions is that you can’t use subqueries. The workaround is simple though — just create more columns and use multiple expression boards.
A note about AIP
Over time, I do expect AIP Assist to make it easier and easier to write Contour Expressions. And that will be great! But it hasn’t arrived to Contour Expressions yet, so in the meantime it’s helpful to learn how to leverage this useful tool in the Contour toolkit.


